Connect any API endpoint → Build dashboards with Drag & Drop → Share as a Live Link for Real-Time monitoring across your entire team
A complete system built for Operations, Manufacturing, and Monitoring teams who need unrestricted real-time data visibility.
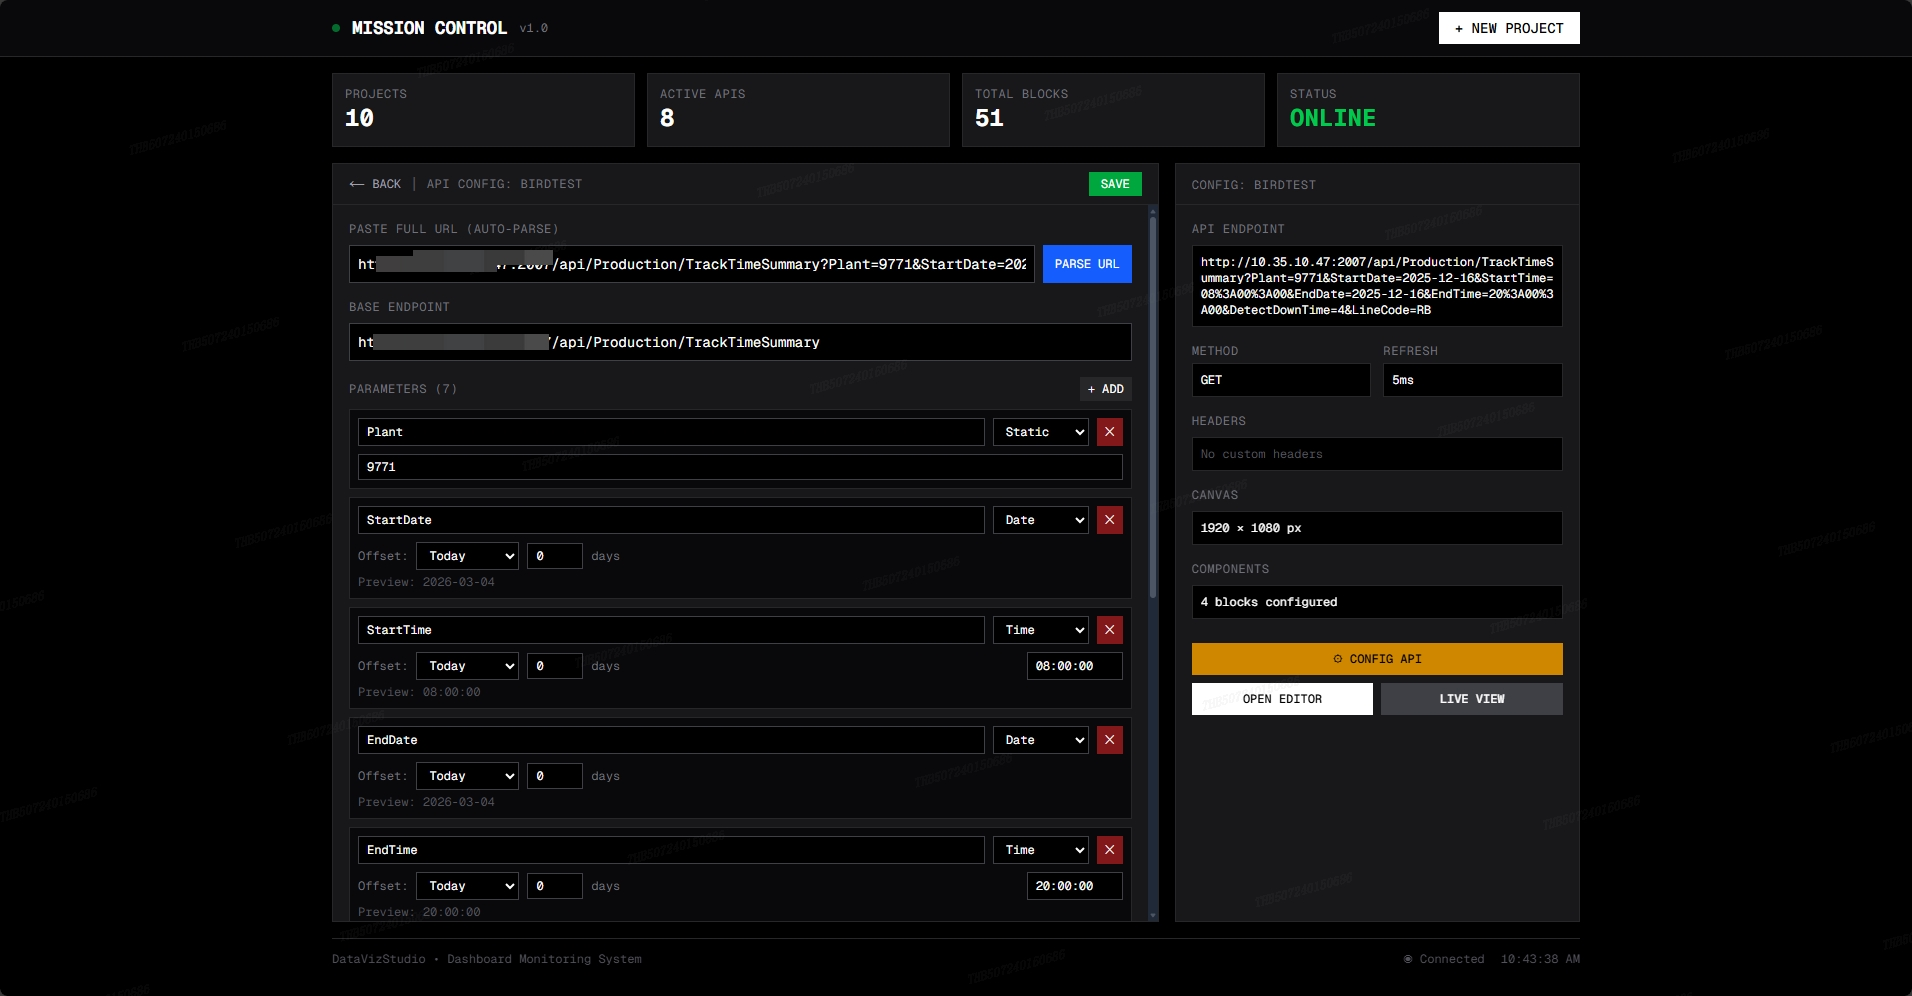
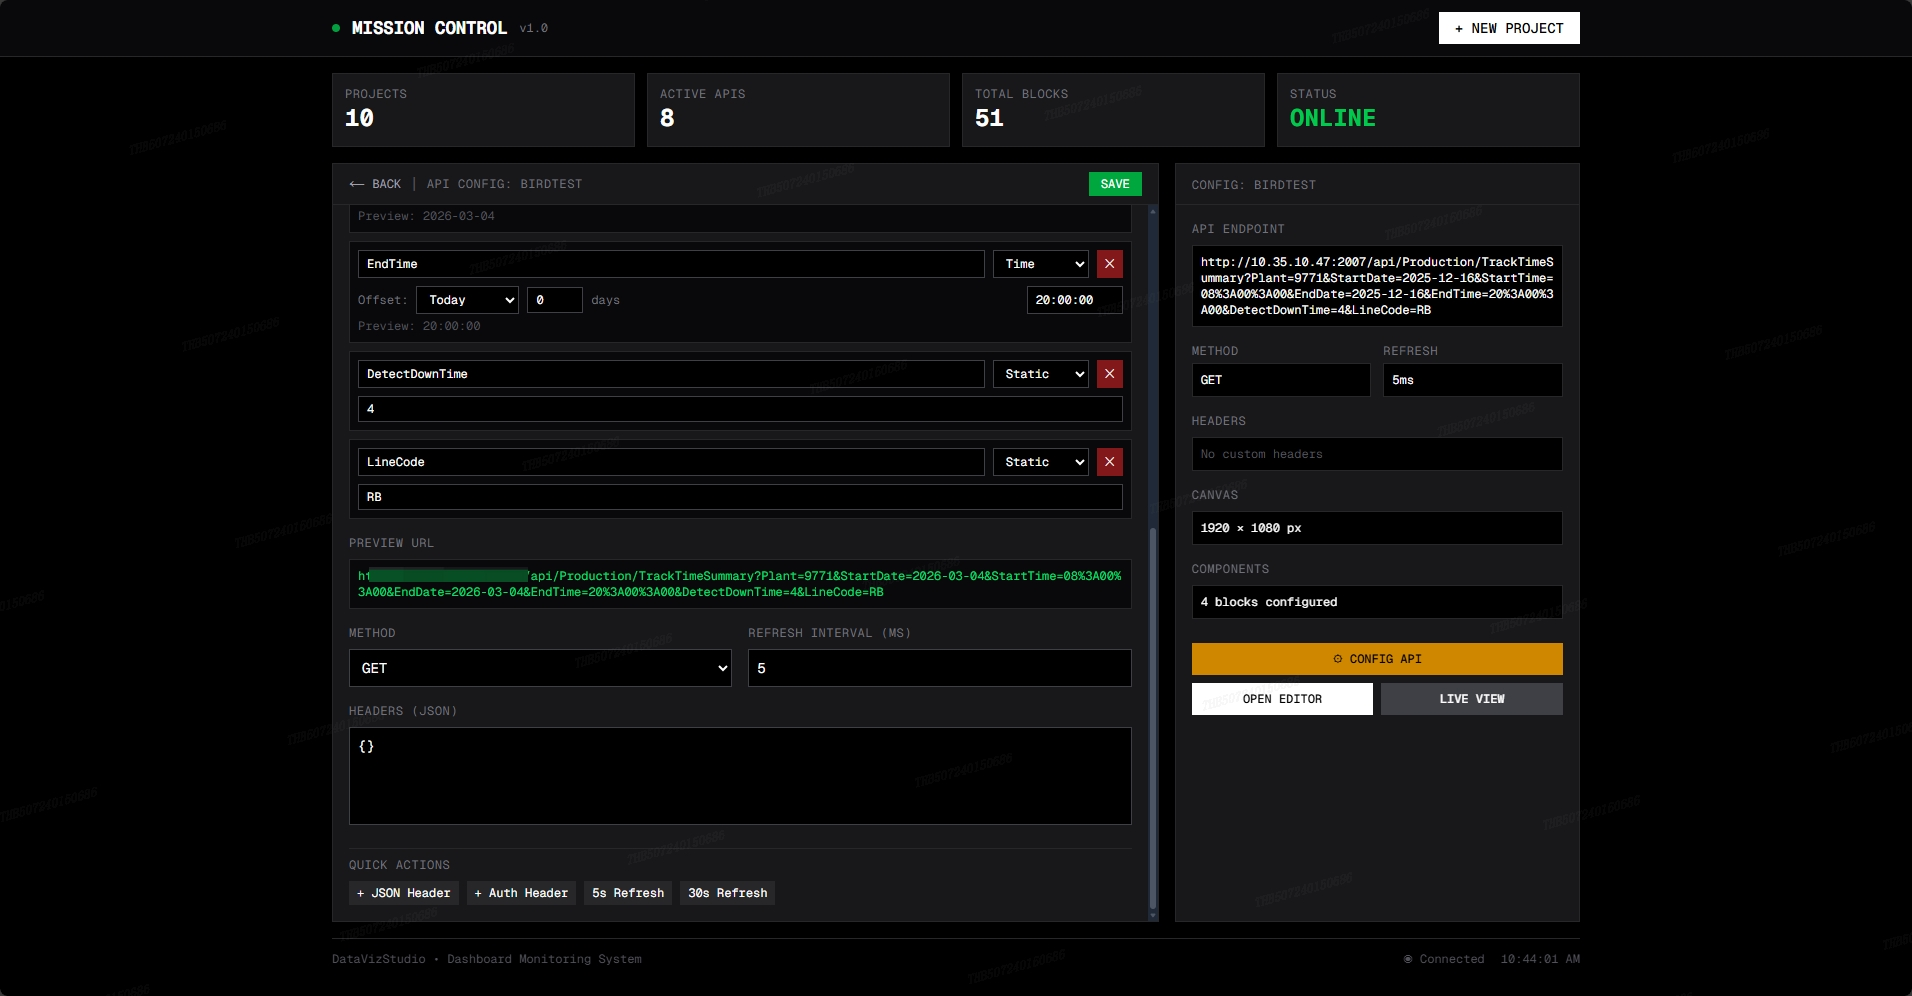
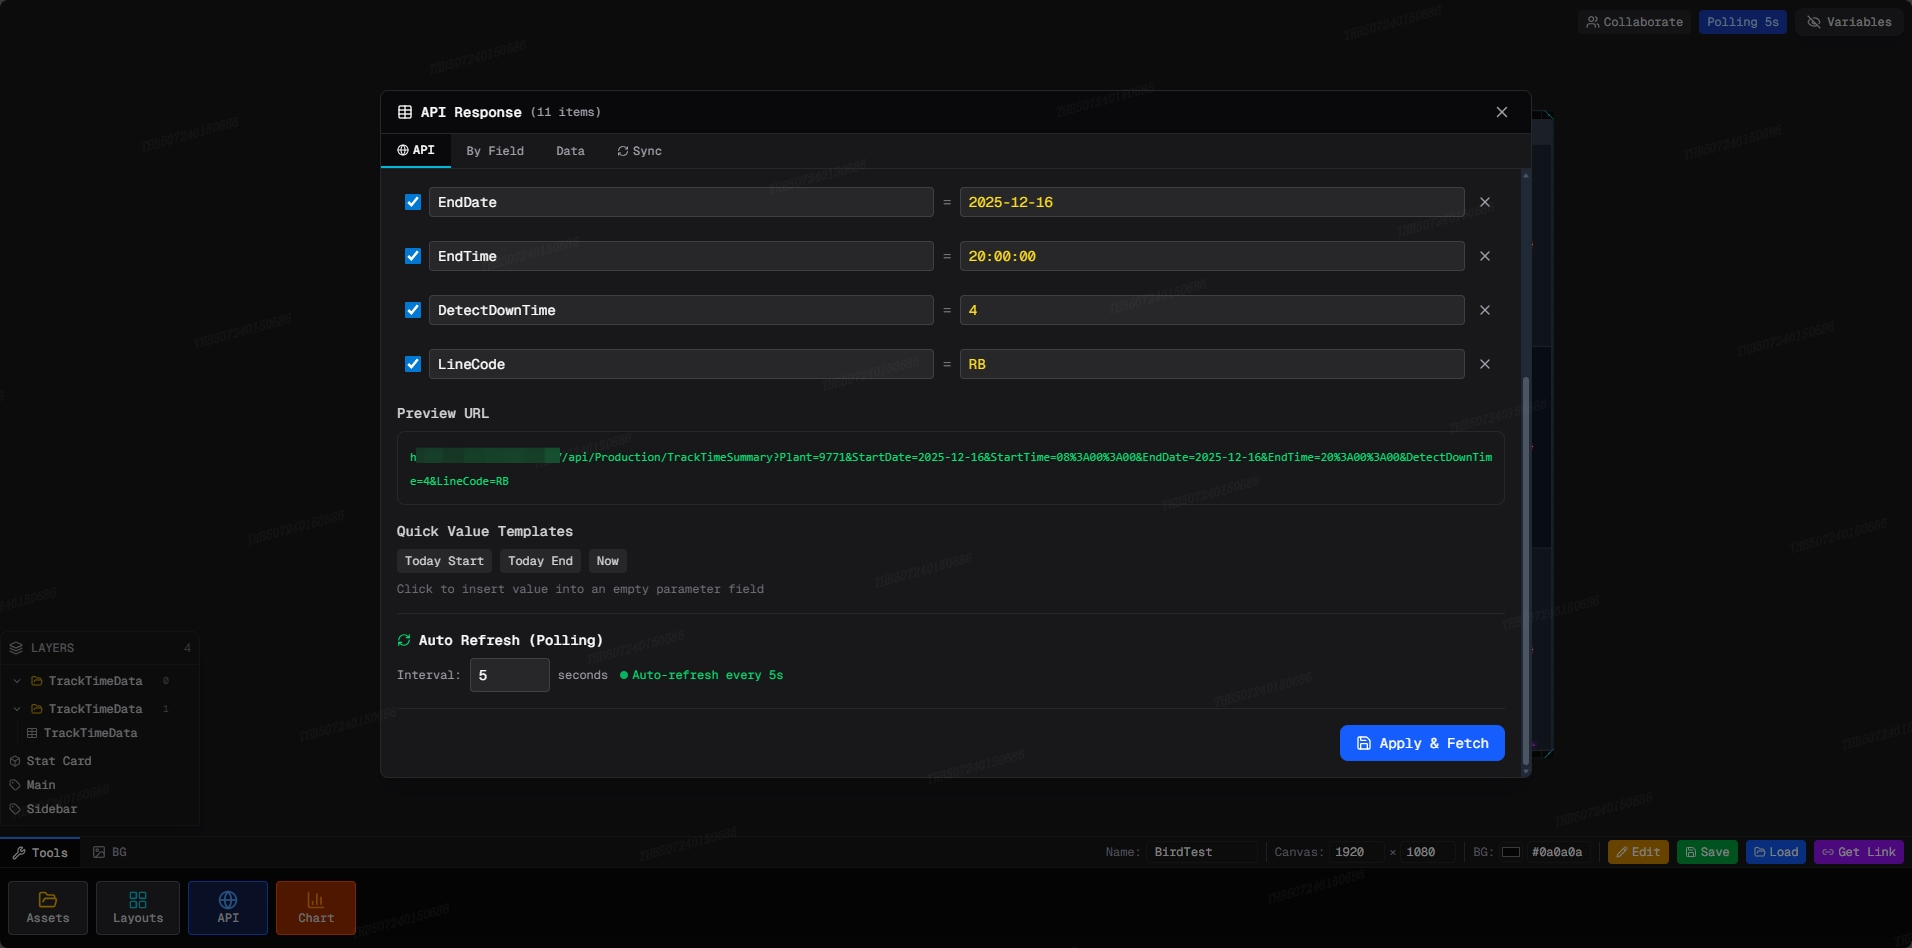
Paste any API URL and go. Supports GET/POST with custom headers and polling intervals as low as 5ms for maximum data velocity.
Auto-Refresh · Headers · PollingA 1920×1000px canvas with full drag-and-drop. Freely arrange, resize, and style components with zero code required.
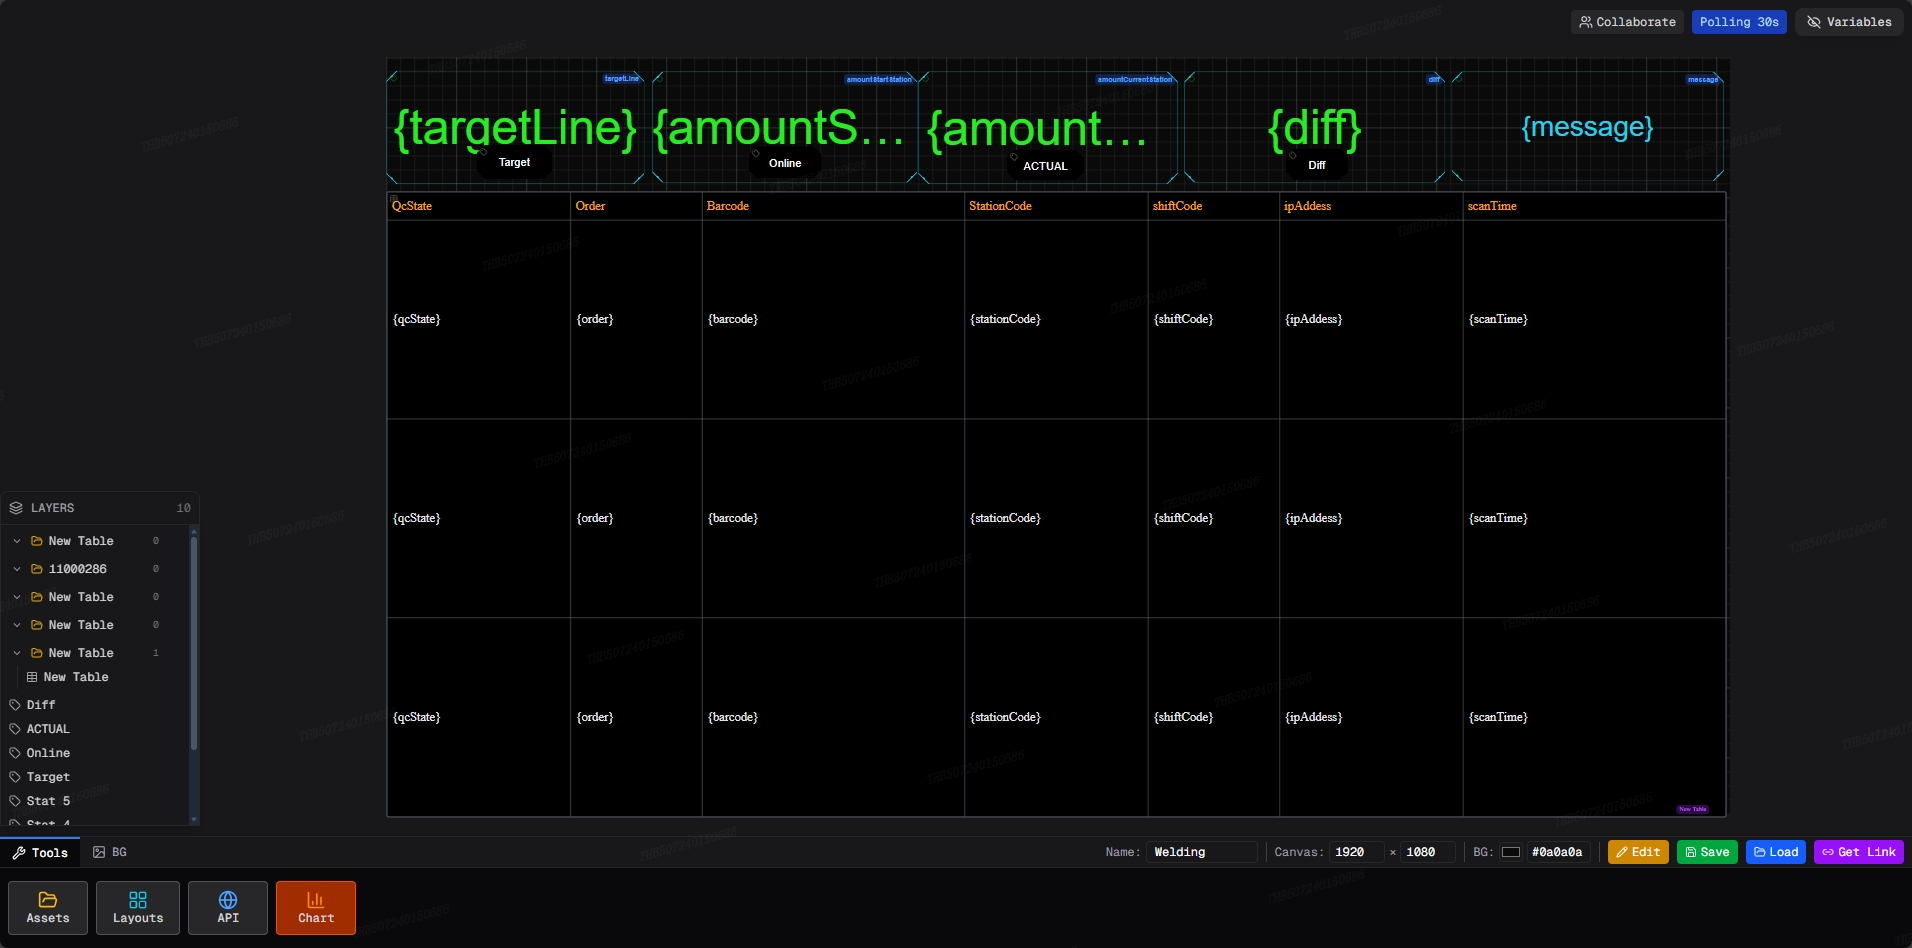
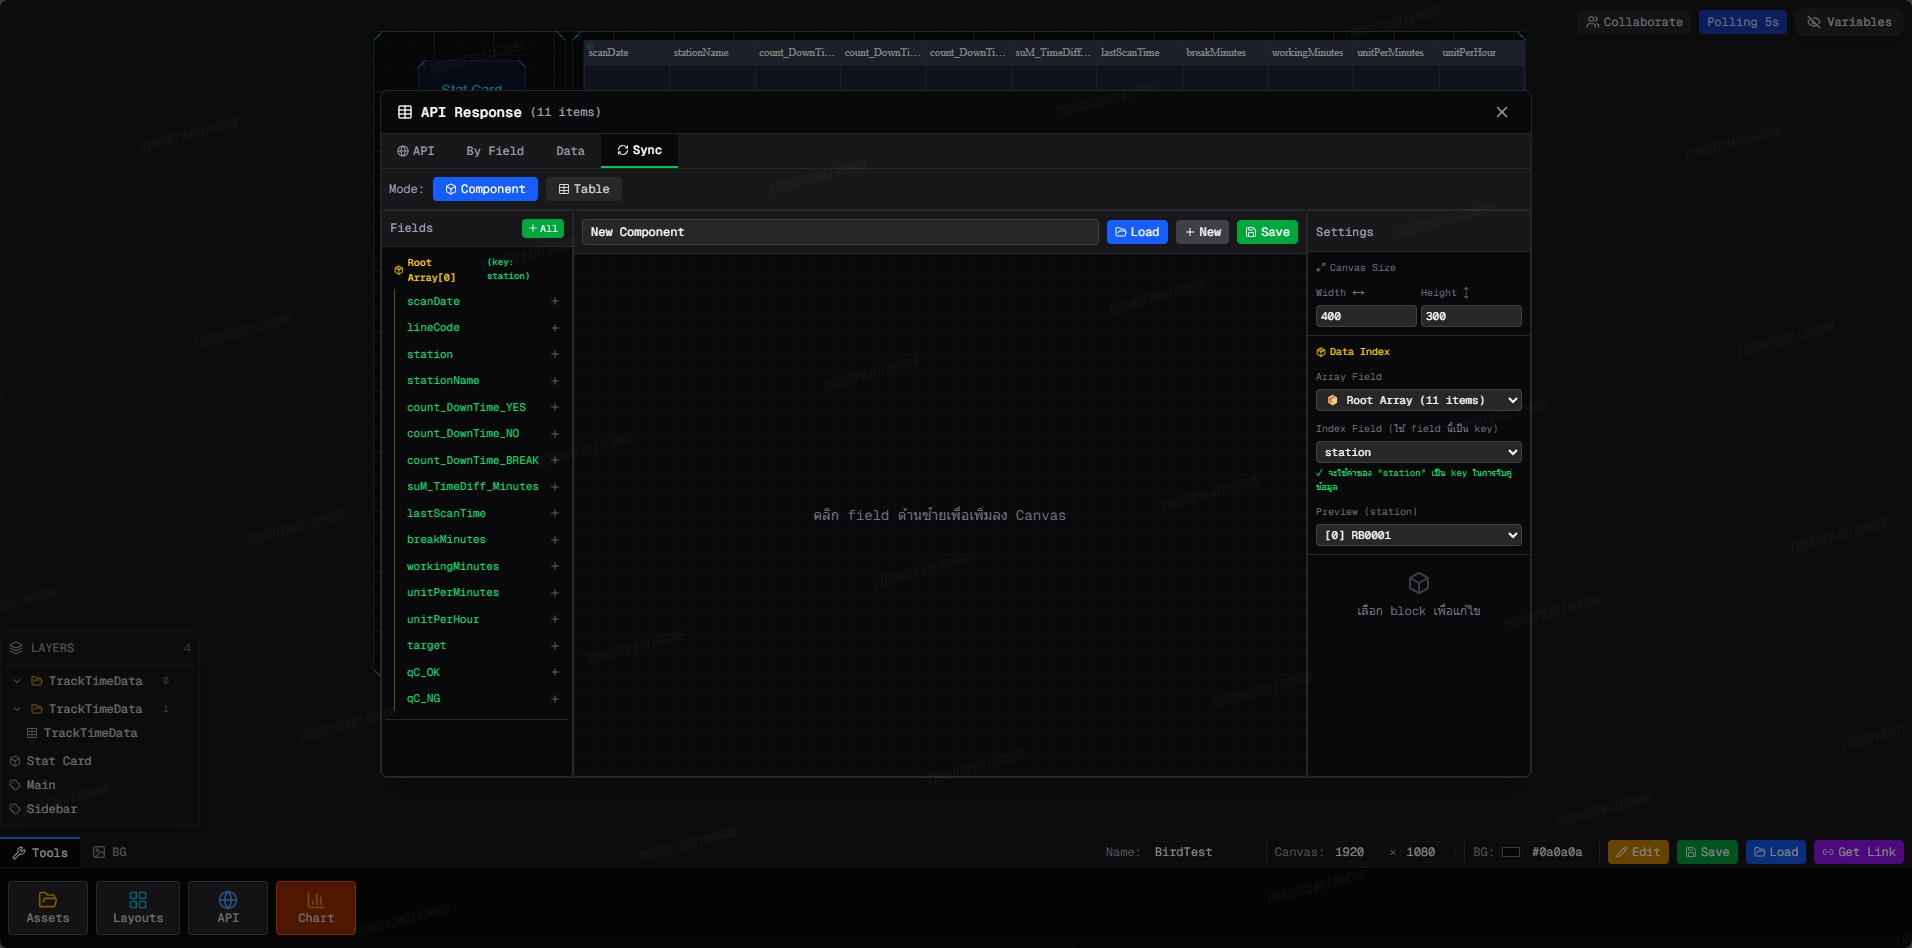
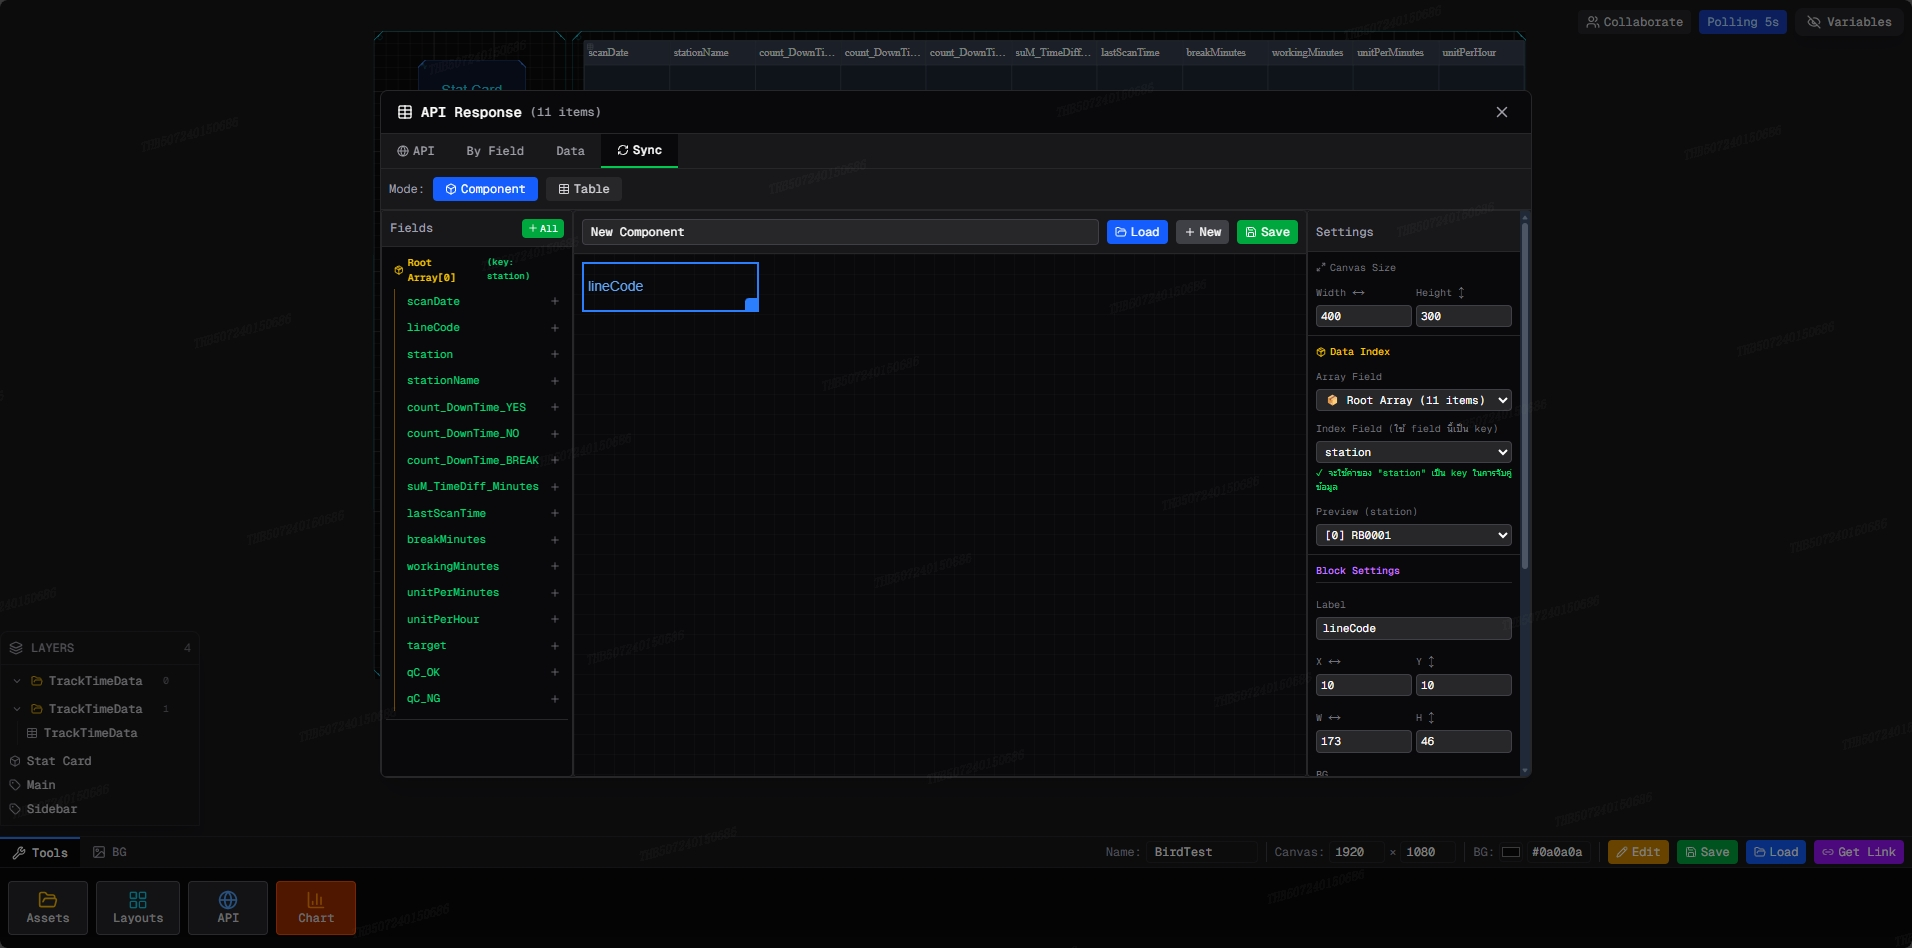
Drag & Drop · 1920×1000 · No-CodeBuild components directly from API JSON fields. Use {[0].fieldName} template syntax to bind live data to any UI element instantly.
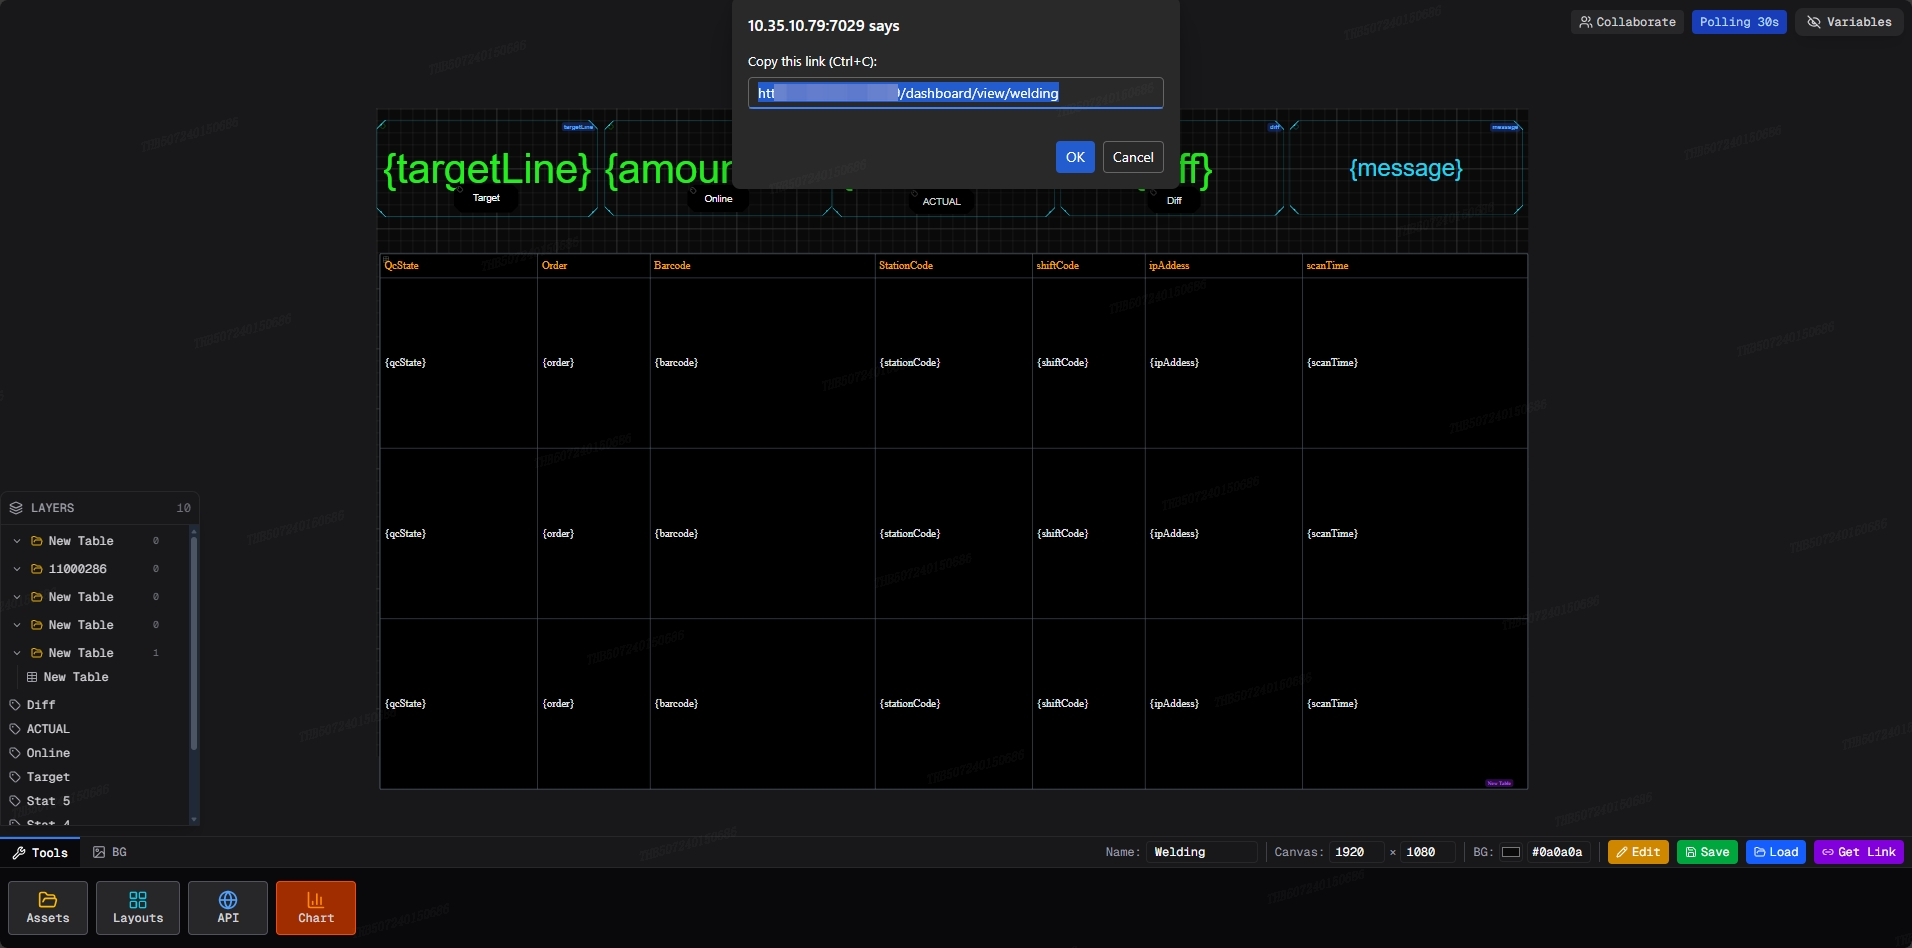
Share any dashboard as a public URL. Data updates in real-time according to your polling config — no login required to view.
Public Link · Real-Time · All DevicesEdit dashboards simultaneously with your team. See live cursors, layout changes, and component moves in real-time — like Figma, but wired to production data.
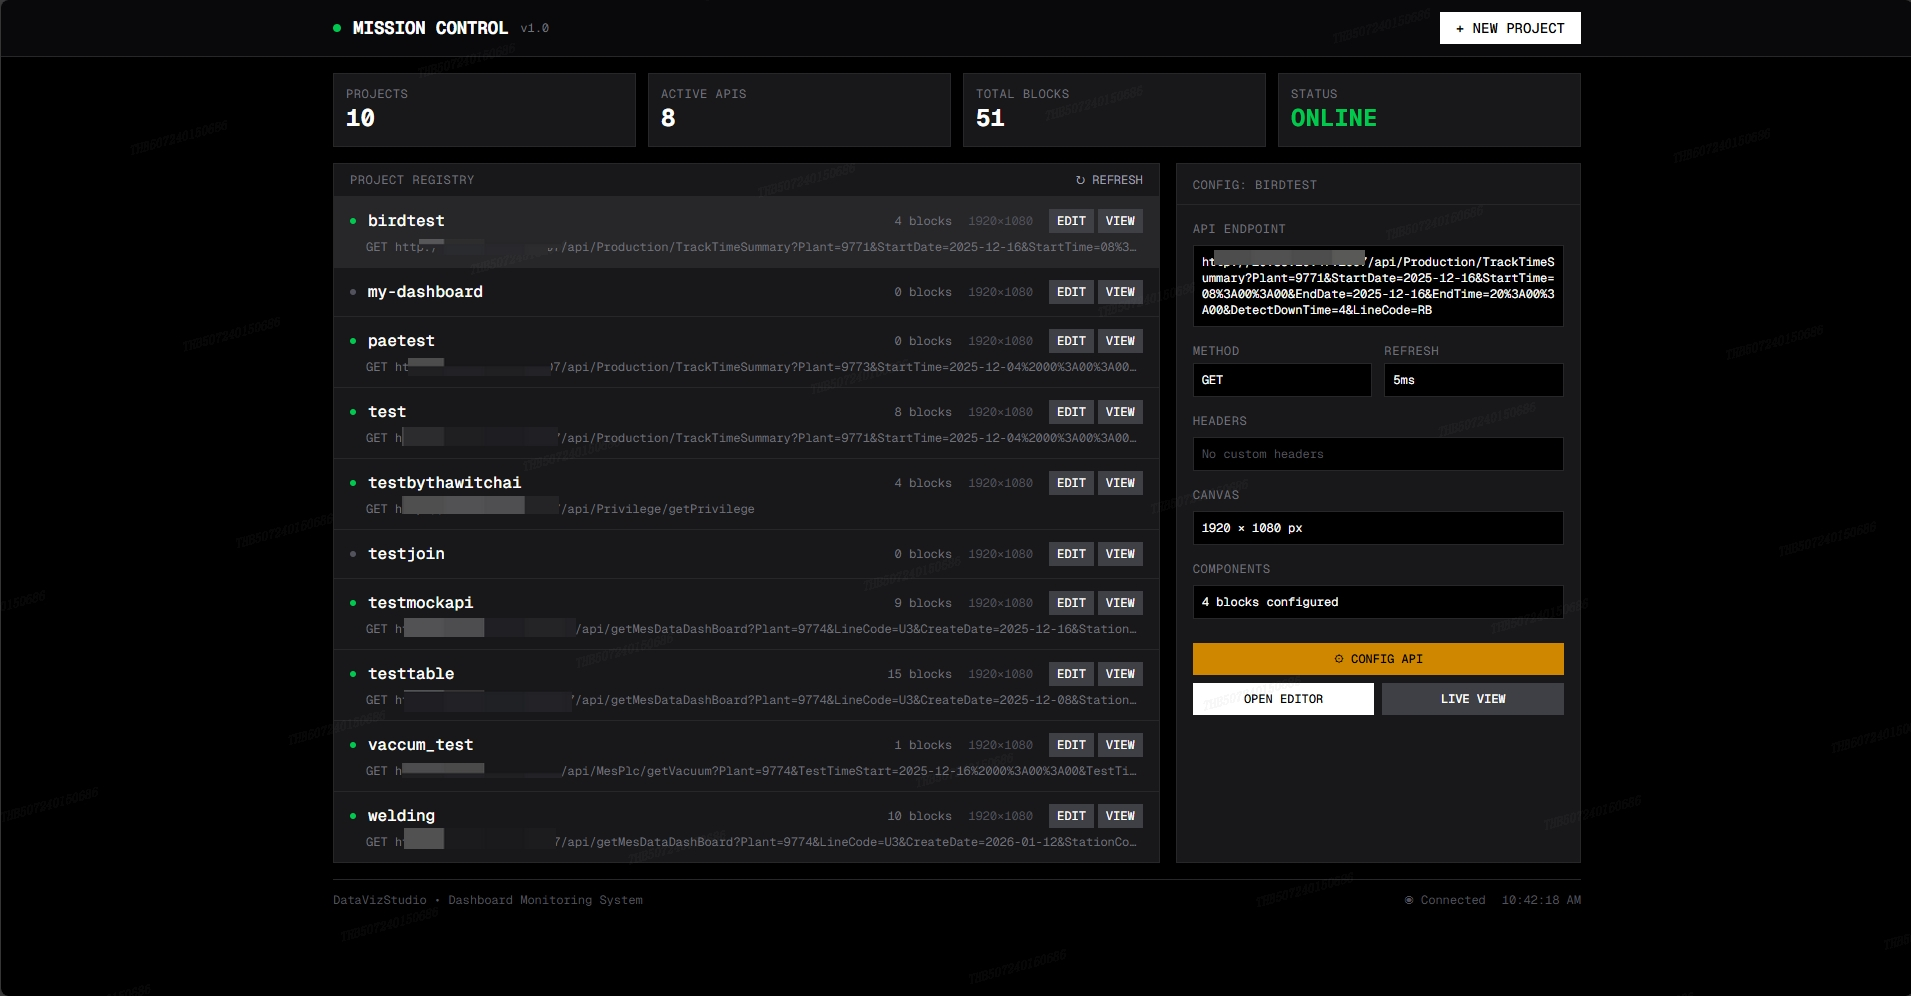
Live Cursor · Multi-Edit · SyncCentral command for every project. View API status, block counts, canvas dimensions, and full config in one unified interface. Scales to 100+ projects.
Project Registry · Status · Config
Every feature built to eliminate the gap between raw API data and decision-ready dashboards.
A centralized command hub listing every dashboard project. At a glance you see block count, canvas resolution, API status, and last-known endpoint for each project. One-click access to Edit or Live View from a single screen.
Connect any REST endpoint in seconds. Paste the URL, select GET or POST, add authentication headers, and dial in your polling interval — from 5 ms for near-realtime sensor feeds down to minutes for slower KPI data. The engine fetches, parses, and streams JSON to your canvas automatically.
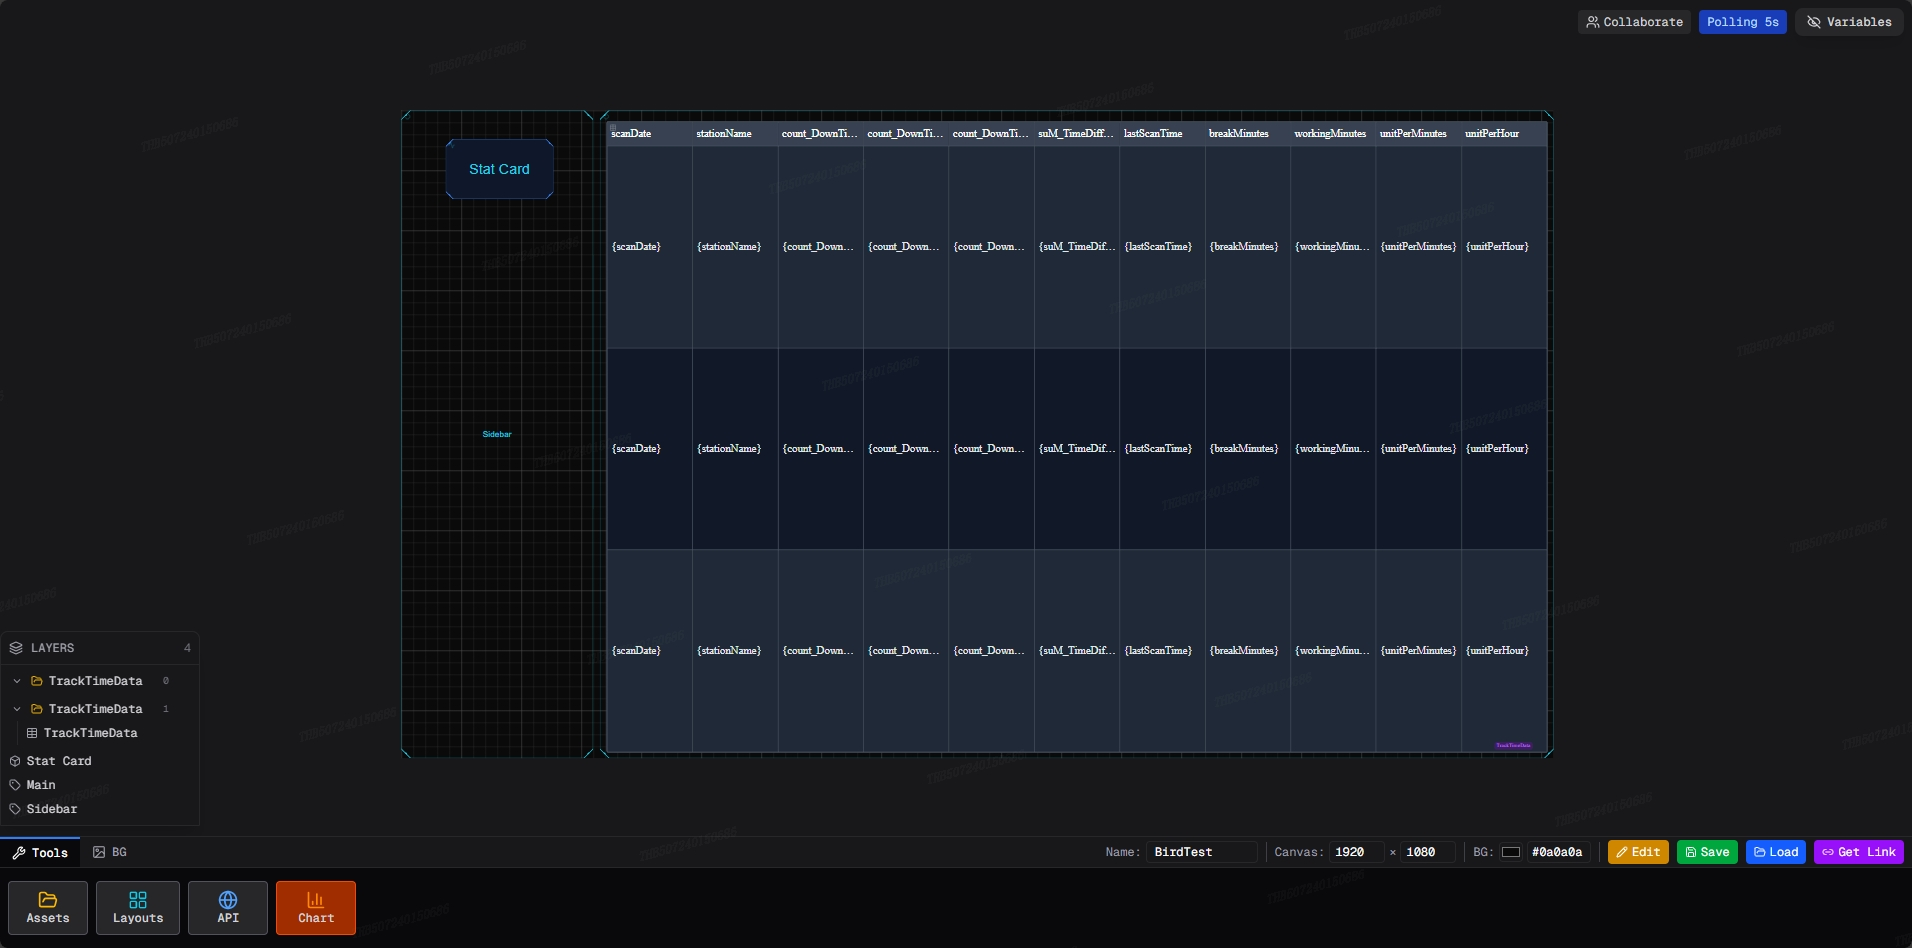
A full 1920 × 1000 px canvas where every component is freely positioned and resized. No forced grid snapping — arrange gauges, text blocks, charts and status badges exactly where needed. Pan, zoom, multi-select and group with keyboard shortcuts built for power users.
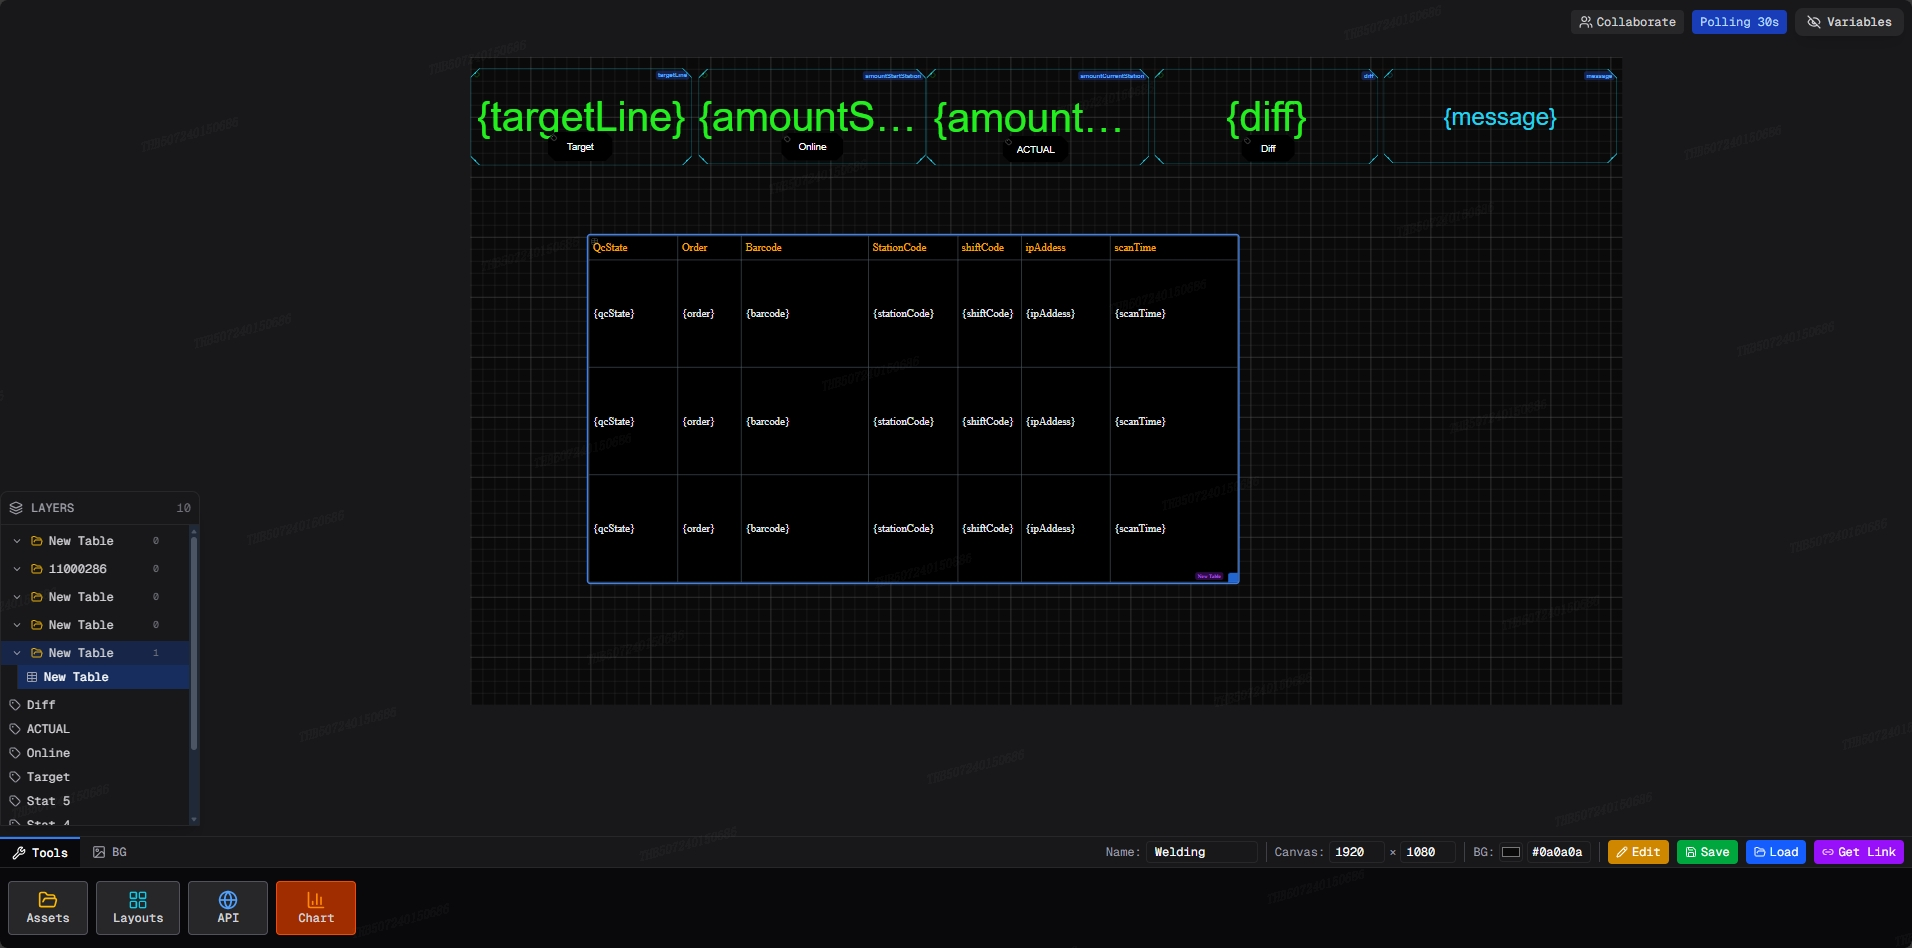
Generate UI components directly from the fields returned by your API. Use the {[0].fieldName} template syntax to wire any JSON value to a Text label, Number readout, Status badge, or Chart series — zero manual mapping.
One button generates a shareable public URL. Anyone with the link sees the dashboard refreshing on the same polling cadence you configured — no login, no install, no browser plugin required. Works on factory floor monitors, tablets, phones, and control room displays at full resolution.
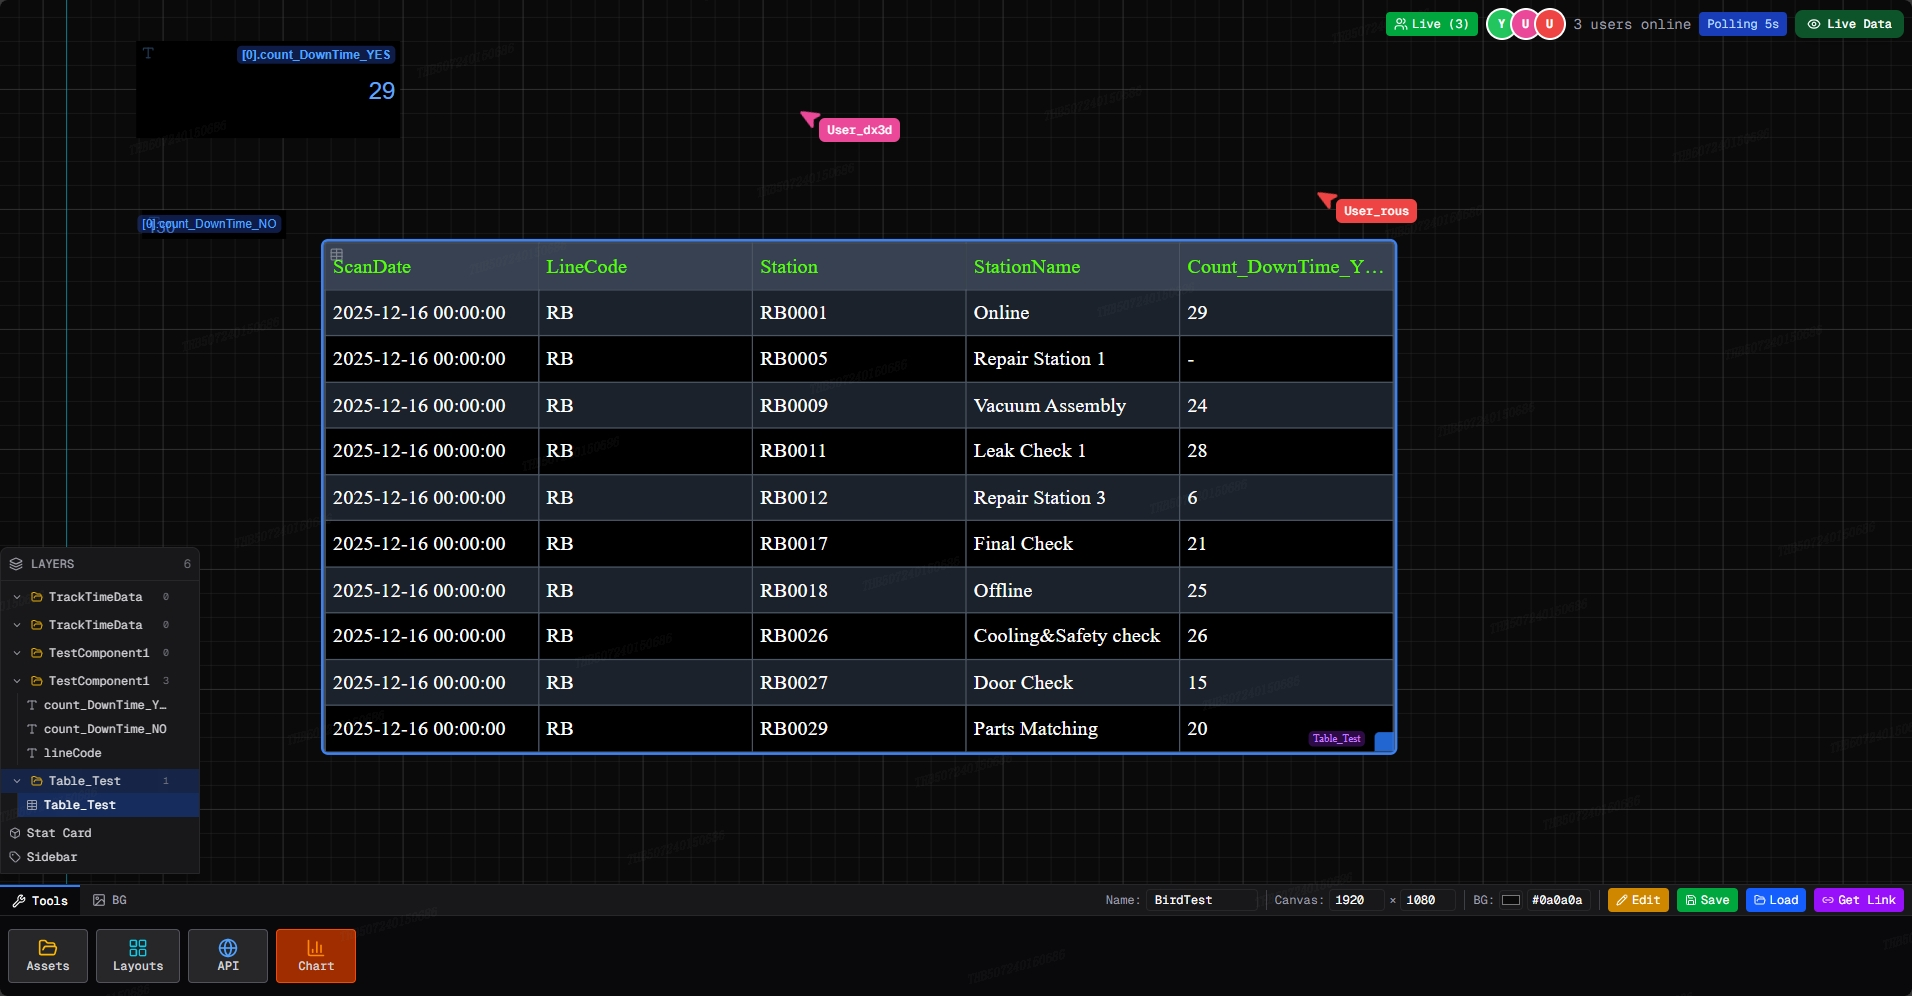
Multiple editors work on the same canvas simultaneously. Every participant sees live cursor positions, component moves, and layout edits as they happen — no refresh, no merge step, no file lock. Identical to collaborative design tools, but wired to live production data.
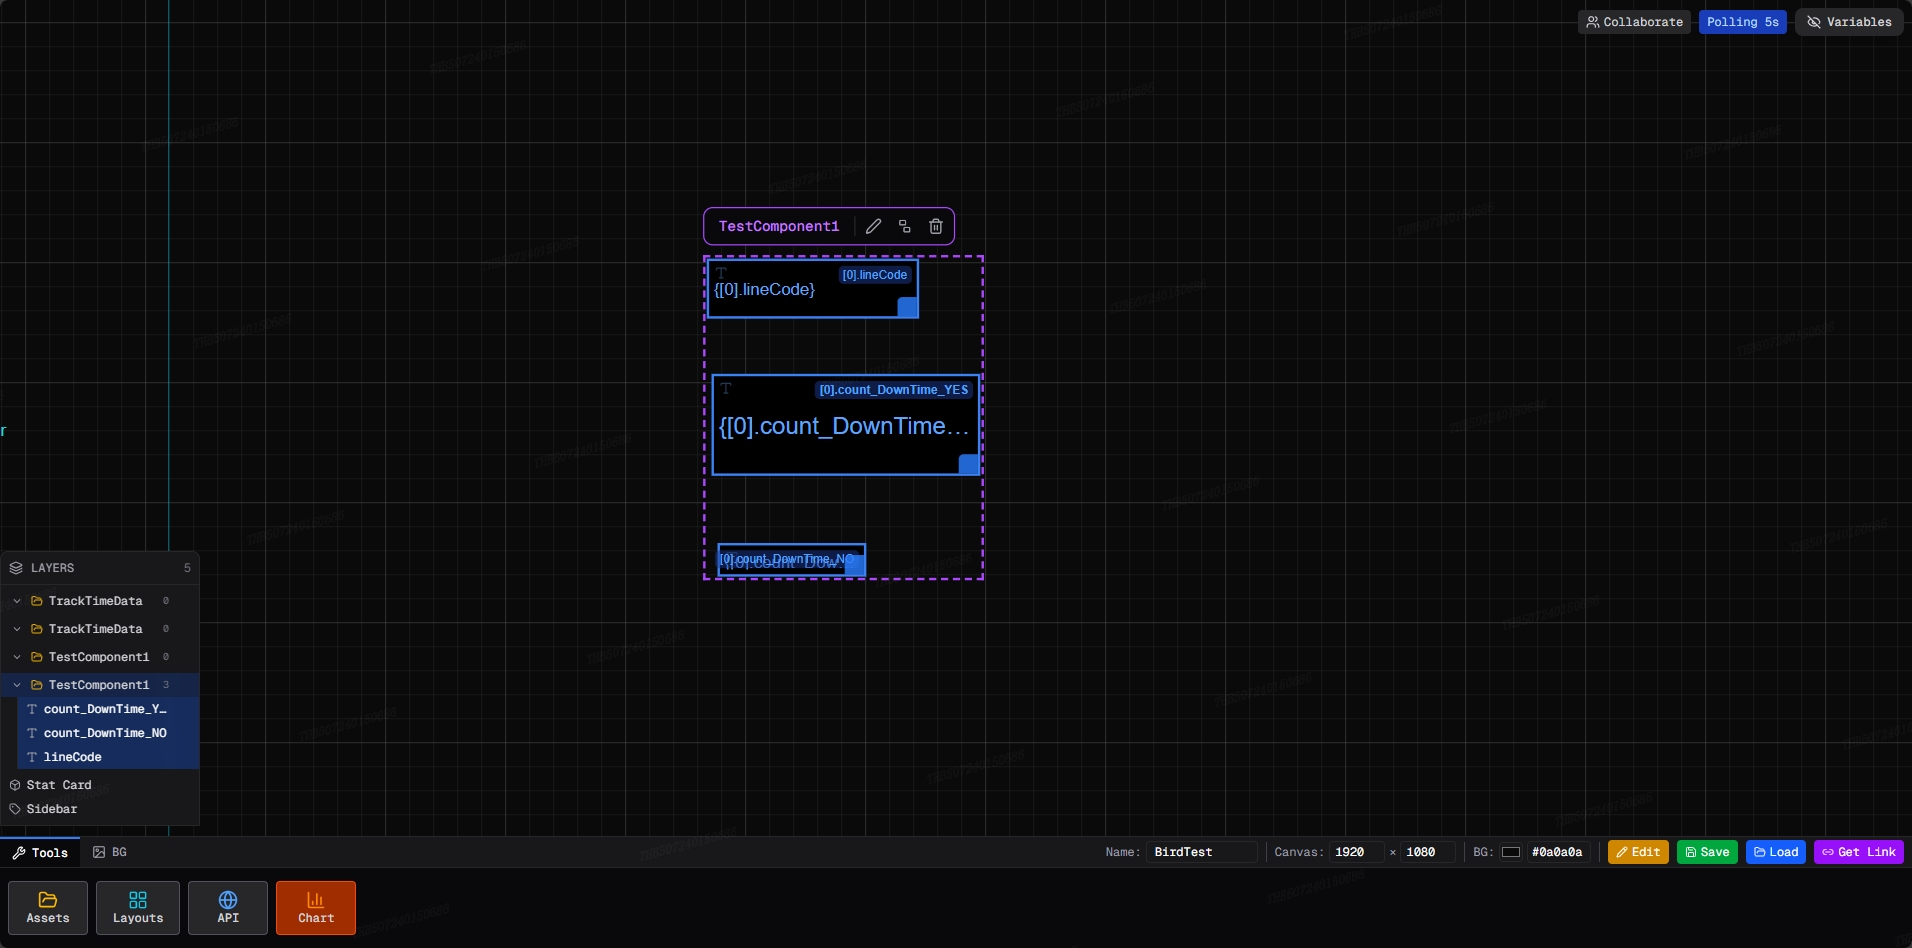
Every block, group, and binding is surfaced in a structured Layers panel. Rename, reorder, hide, lock, or jump to any component without hunting on a cluttered canvas. Nested component groups keep complex dashboards with 15+ blocks organized and maintainable.
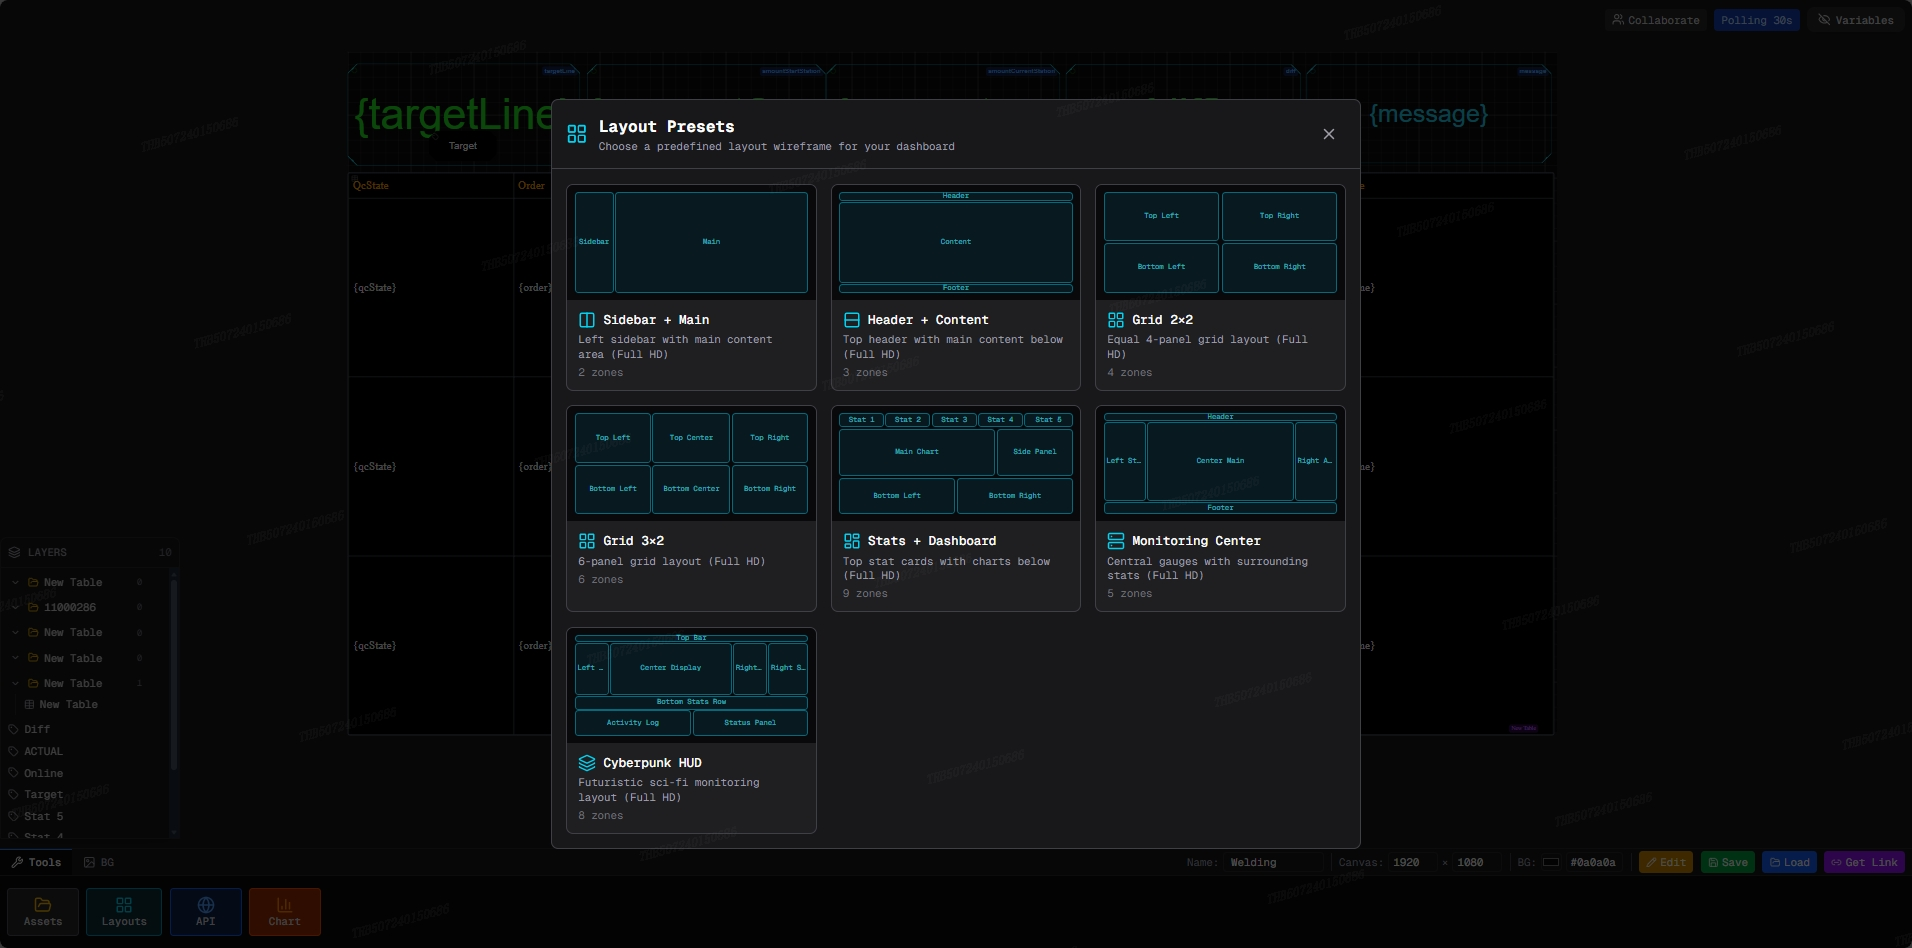
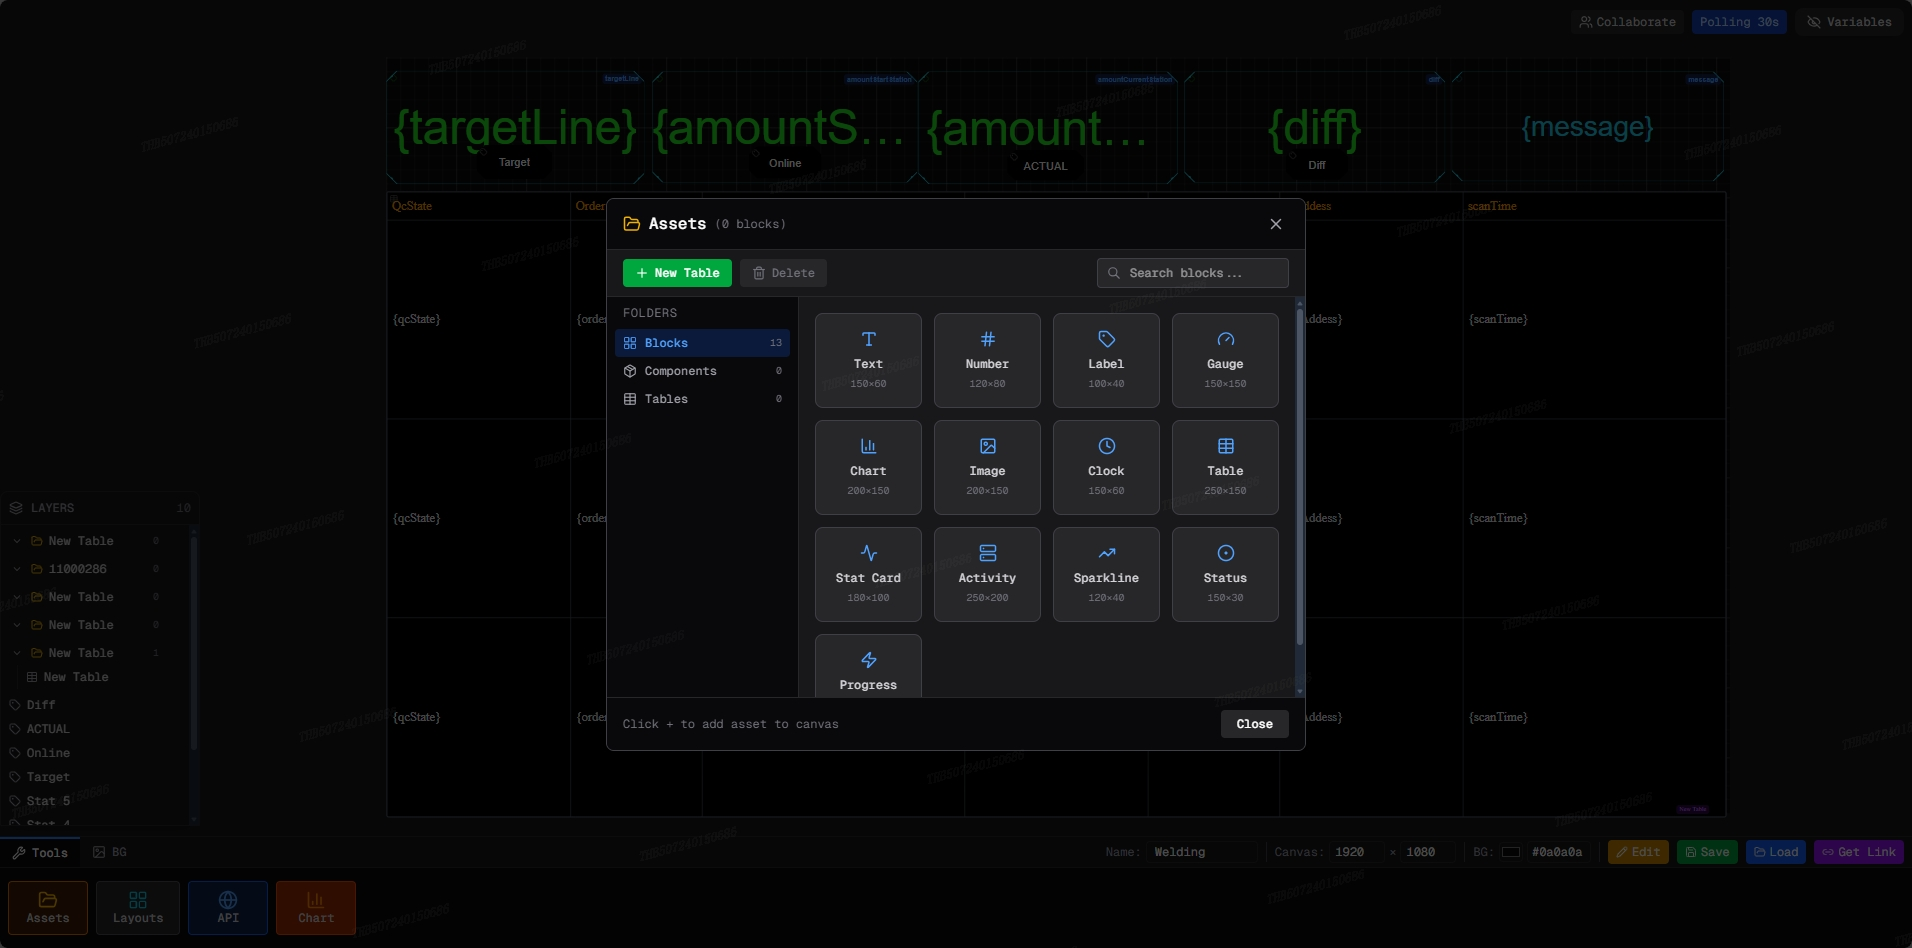
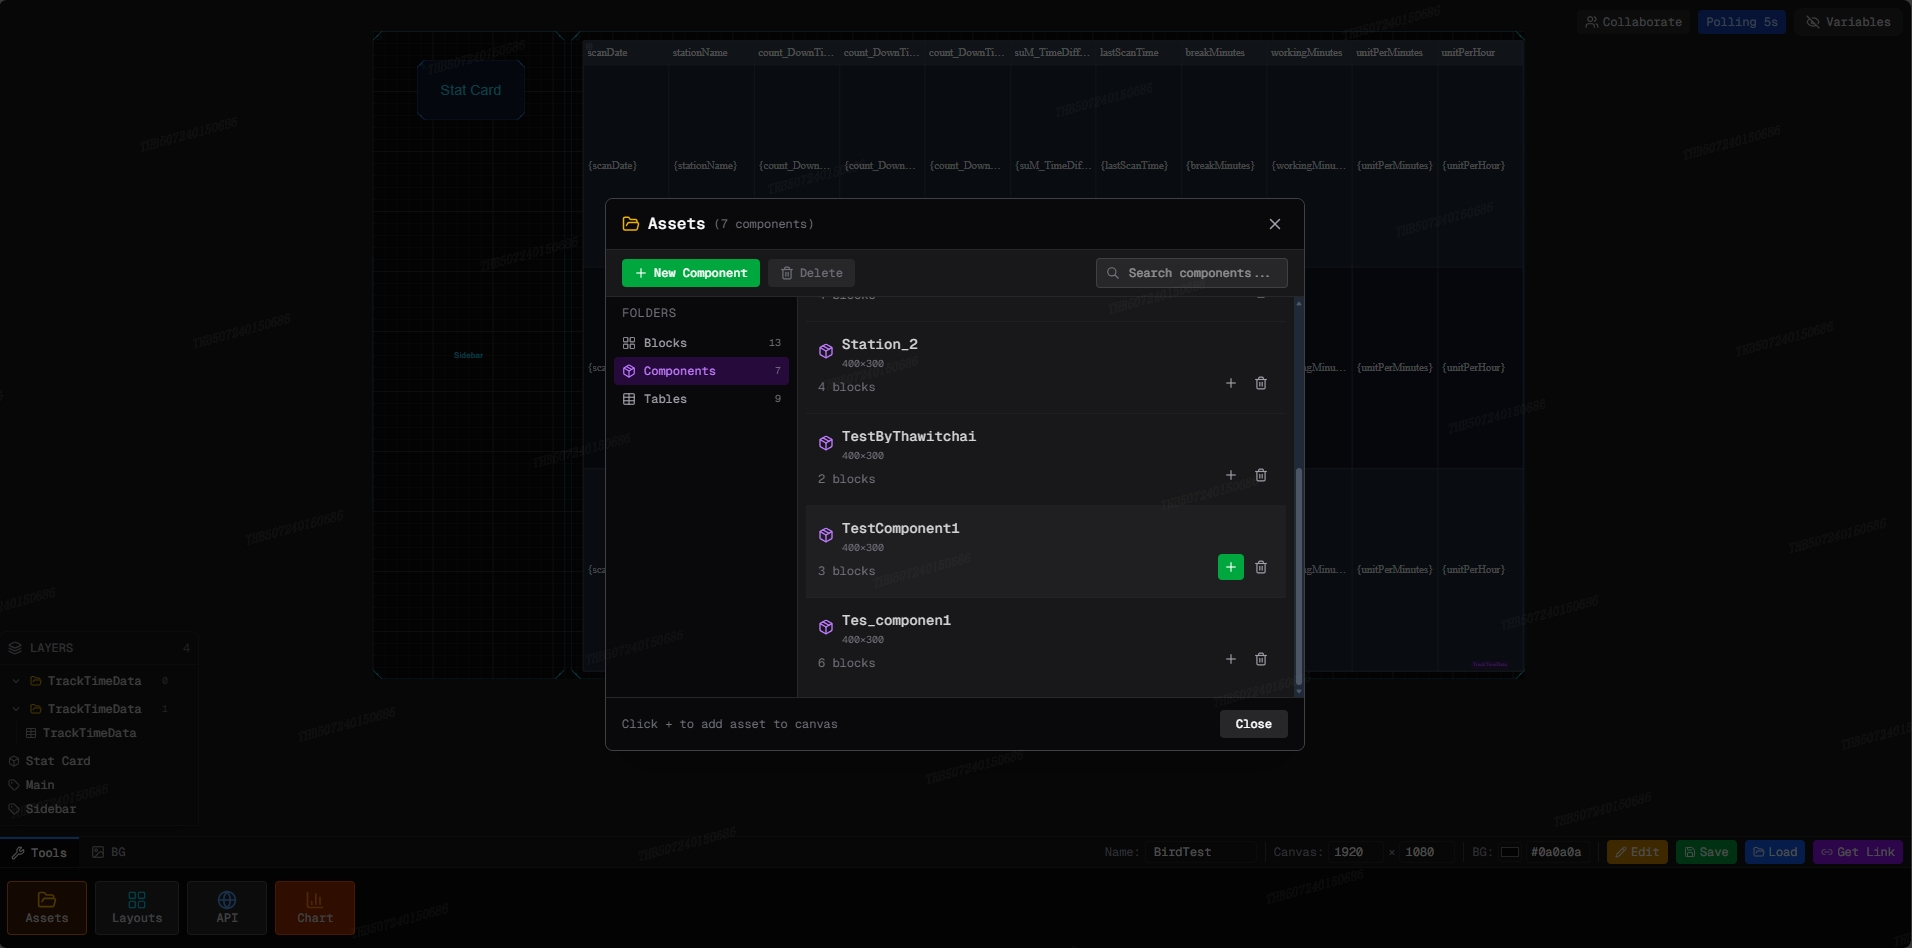
A built-in library of production-ready components in the bottom toolbar — Assets for pre-built widgets, Layouts for full-page templates, and Charts for time-series, bar, gauge, and pie visualizations. Drag any item onto the canvas and bind it to your data in one click.
Define dashboard-level variables to parameterize URLs, filter values, or swap data sources without rebuilding the canvas. The Polling Control bar lets you pause, resume, and adjust refresh cadence live — useful when investigating anomalies or reducing server load during off-peak hours.
From API URL to a live dashboard your whole organization can see — in minutes, not days.
Paste your API URL, choose method (GET/POST), set headers and polling rate. The system fetches and parses JSON automatically.
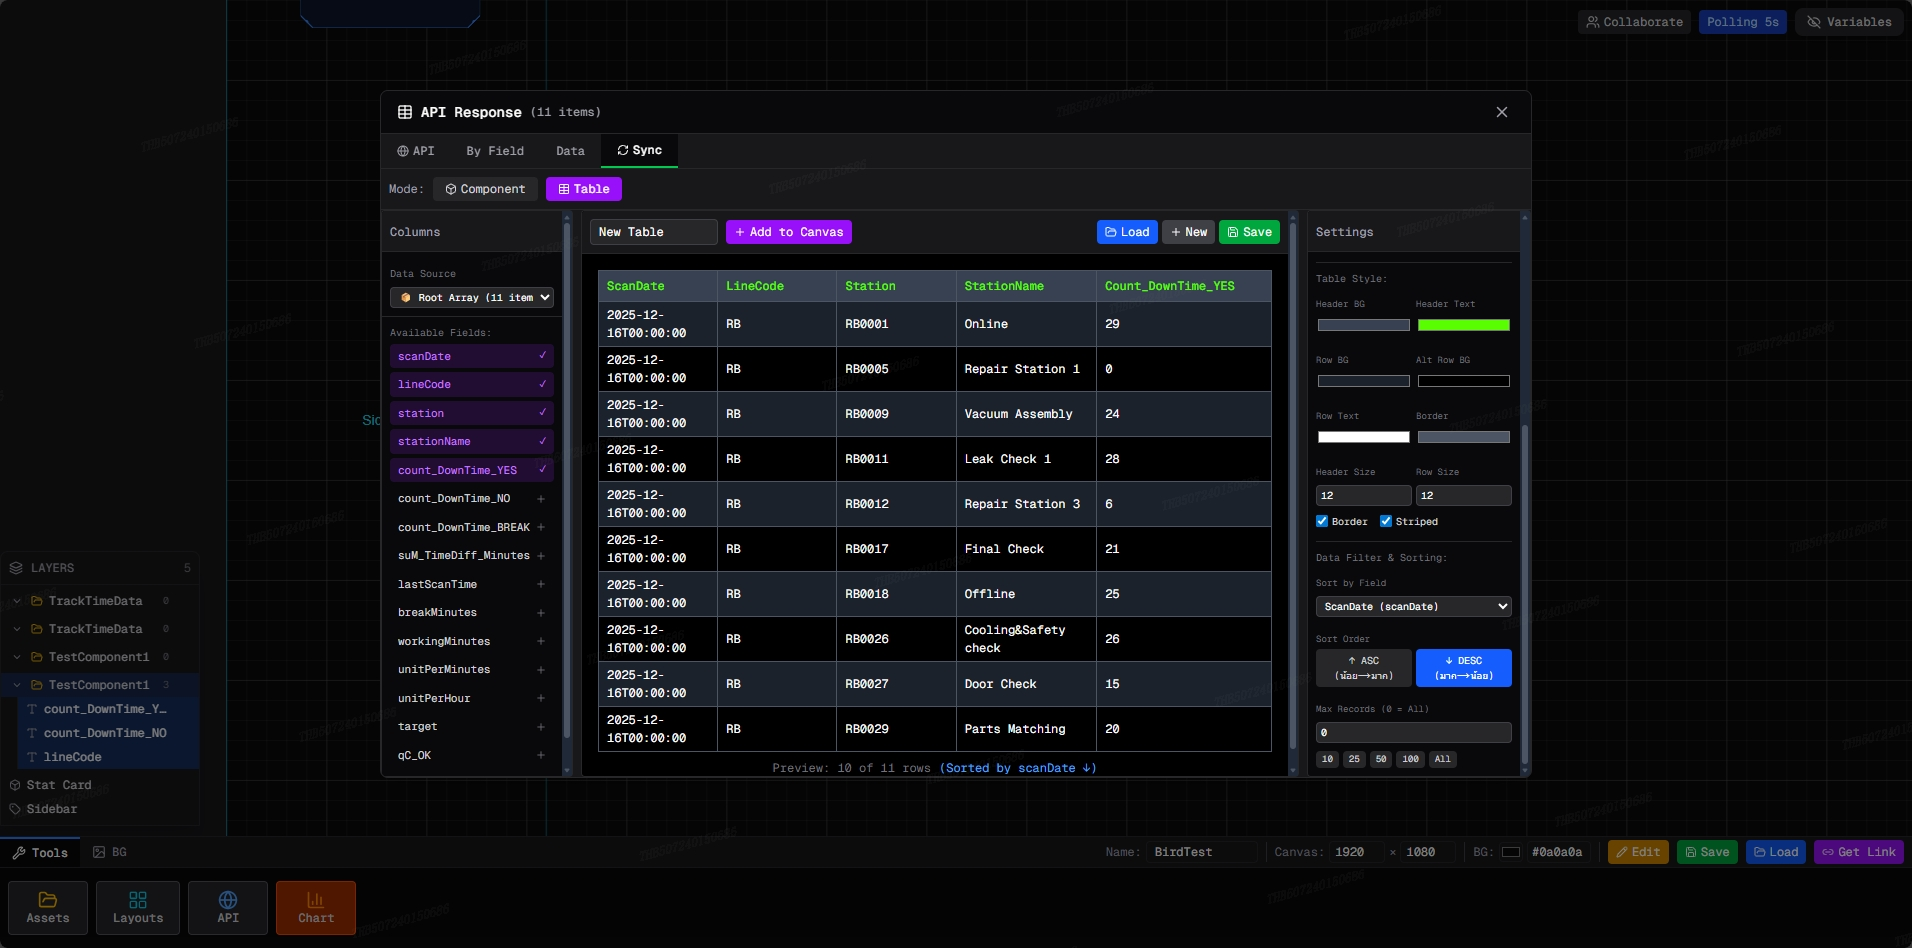
Select fields from the JSON response and generate components — Text, Number, Badge, Chart — with data binding via template syntax.
Drag components onto the 1920×1000 canvas. Arrange, resize, and style layouts freely in the visual editor — no code required.
Hit Live View, get a shareable URL. Data updates on your set polling interval — viewable on any device, same real-time data for everyone.
Work together in real-time — see every teammate's cursor, watch layout changes happen live, no refresh needed. No conflicts, no file locks.
Architecture engineered specifically for real-time manufacturing and industrial data at scale.
Build your first dashboard in under 5 minutes. No coding, no design skills needed.